
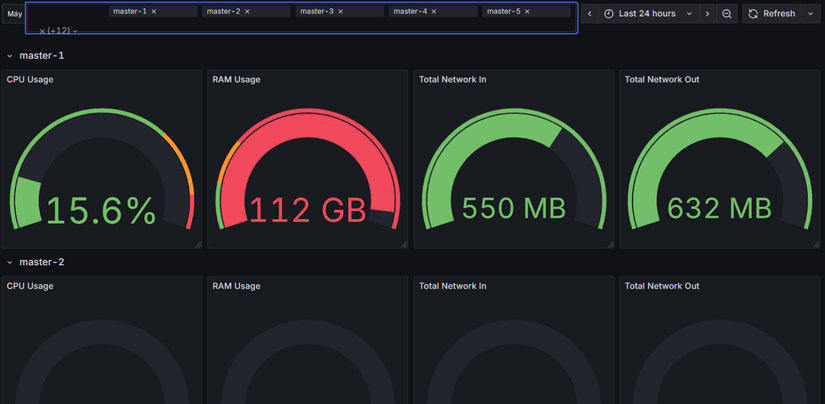
When I set up Grafana, I mostly made a pretty basic dashboard from a template, mainly to monitor the Debian VPSs I run. It looks like this.
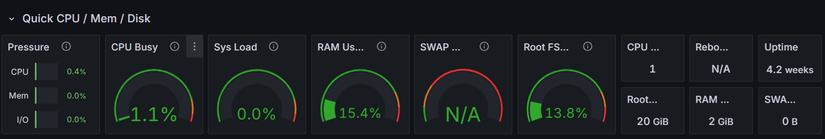
I mostly looked at this, but since I started querying Prometheus directly on the Gethomepage dashboard, I kind of stopped caring about Grafana.
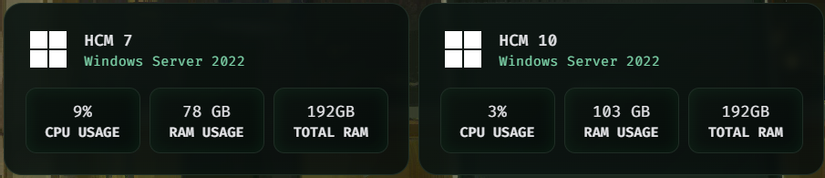
Why bother when everything I need is already here like this.
But maybe I should set up Grafana properly, because later the data will live in Grafana more, and I can also look back in time and analyze Network Traffic—that’s the key.
So today let’s dust off my Grafana.
1.Basic overview with ChatGPT
With a few prompts and a quick look around, I found you can import JSON directly, so I let GPT do it, and the result was like this. Not really as expected.
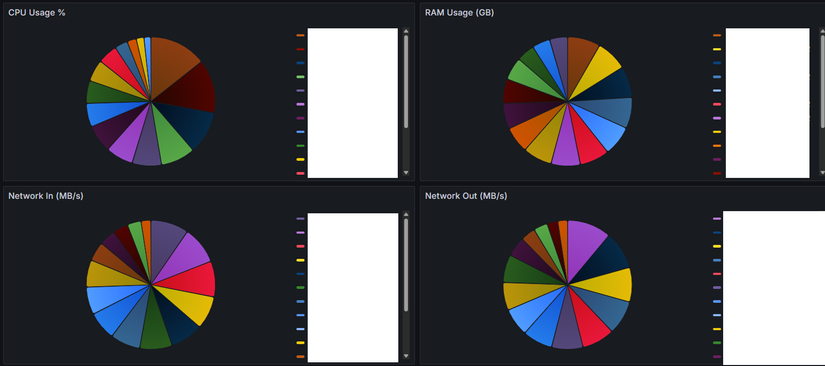
After a few more tries it looked like this
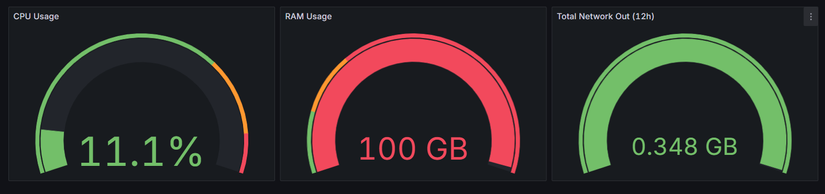
However this approach doesn’t satisfy my use case. I want to monitor across multiple time windows, but this uses the same query style as my dashboard
2. Analyze a few things
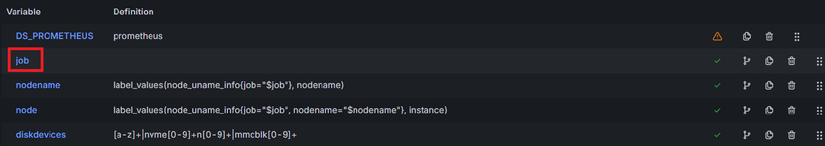
Variable
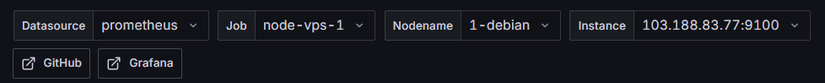
The stuff above are Variables
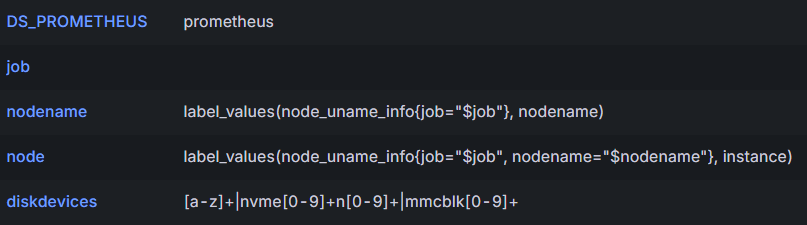
How it’s used in the Query
100 * (1 - avg(rate(node_cpu_seconds_total{mode="idle", instance="$node"}[$__rate_interval])))
The key is [$__rate_interval], this lets the data be filtered by the time range in the time picker.
Goal this time
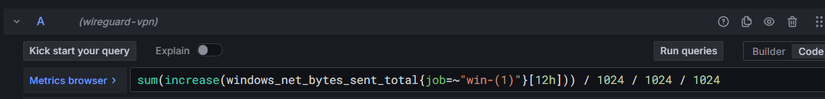
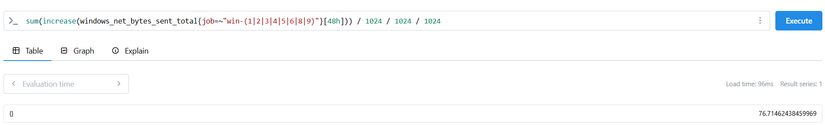
Make the query in Grafana look like Prometheus.
If I paste it directly, it matches the expected value
Next is to allow using variables over time
Switched to both kinds of Variable, but it still doesn’t work
Where is the problem?
Understanding $__rate_interval vs $__range
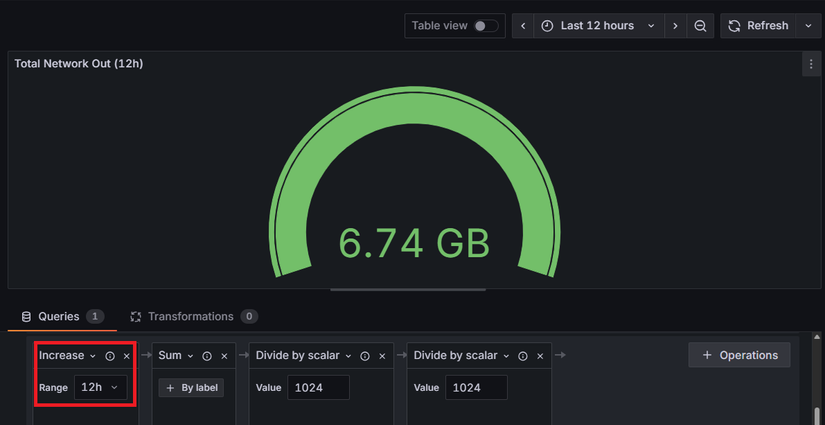
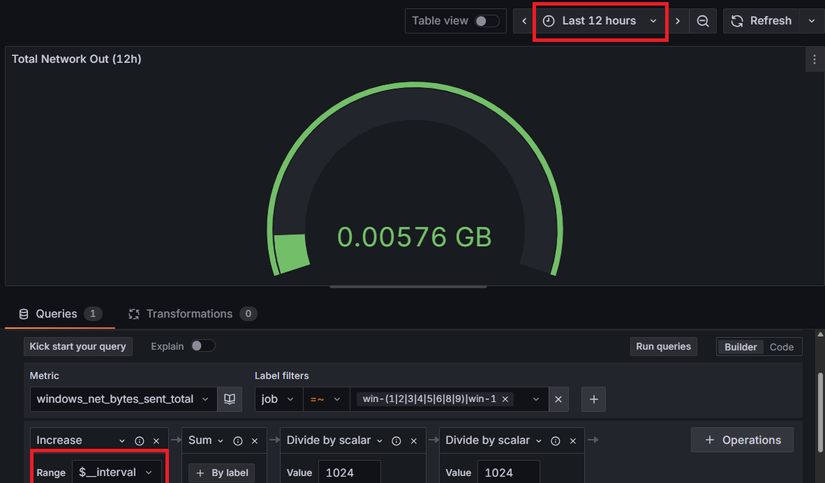
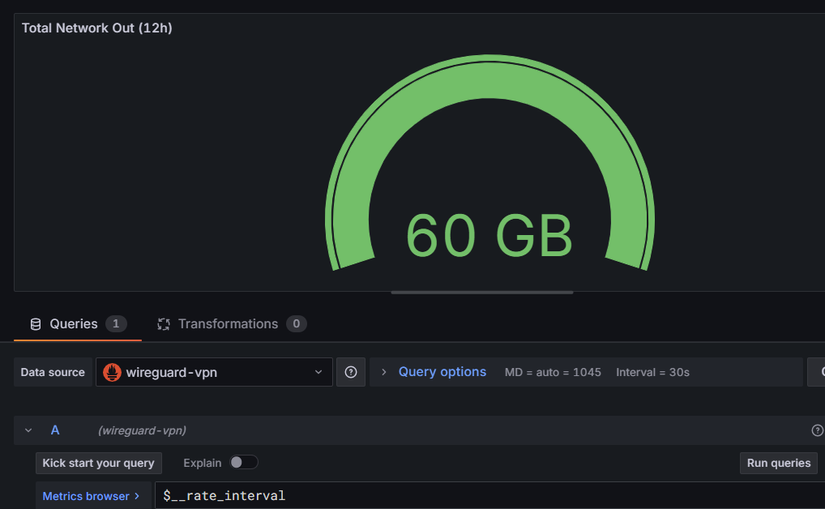
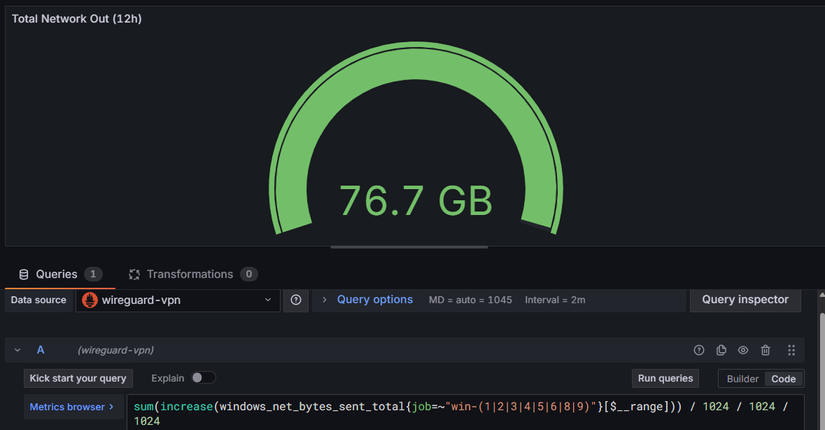
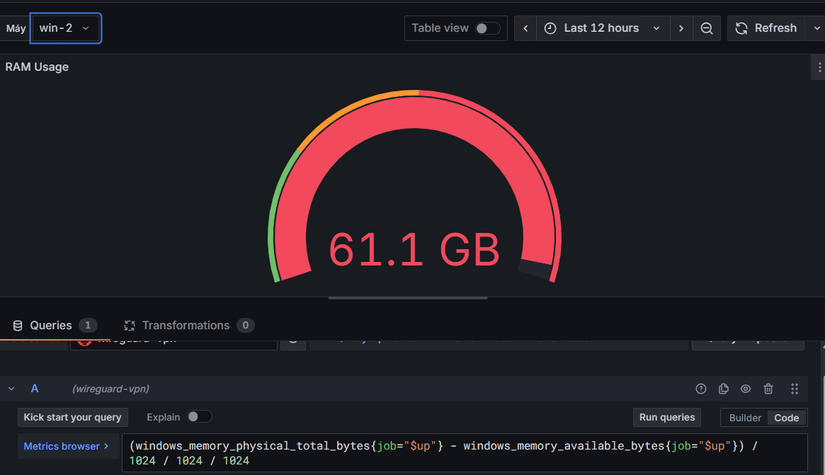
This is $__rate_interval
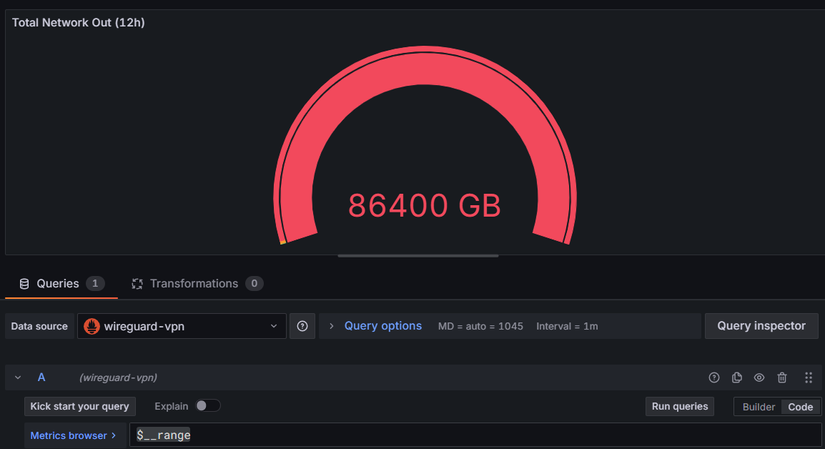
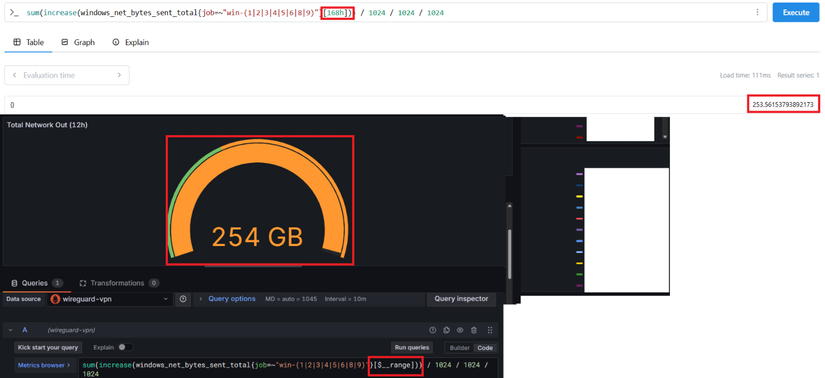
And this is $__range

It’s in GB because I haven’t converted units yet, just debugging. Now I basically understand both.
$__range is for the label
Change the label and the data changes too.
Success
But this chart doesn’t look very fitting, so I’ll leave it for now. Onto the next issue
Goal 2
Can change win-4 to any other
Initial idea
Copy this whole Variable to the other side
But it doesn’t work because it only applies to VPS.
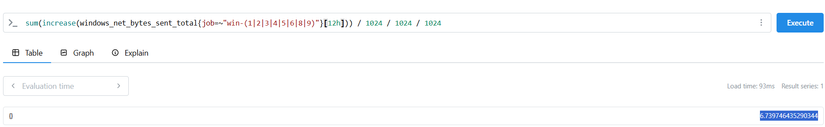
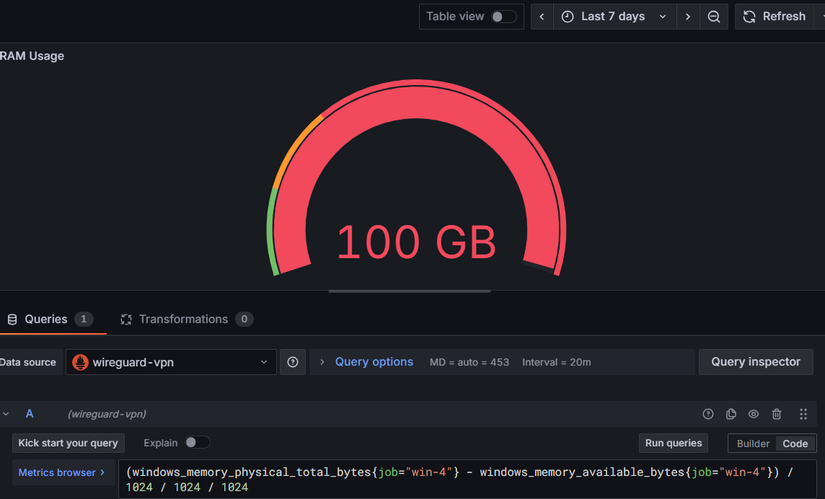
Need a variable that can get Windows Exporter too => up is the answer.
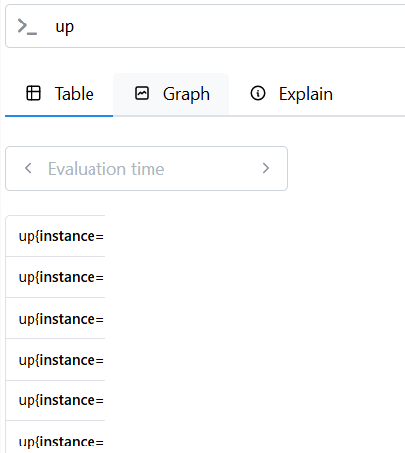
Now use it
Pretty great
Alright I’m heading out to pick up family now.
~4 hours later
Let’s continue, folks
Goal 3
Clone this into 22 items like that, but with different variables
There are two ways: GPT’s way is to use a huge JSON blob, which is insanely dumb. For a platform made for DevOps and SysAdmin, how could it not have a Clone feature
So after messing around for a while I found a way. The feature name is repeat rows and panels along with a video at 6:28 that mentions Multi Value, just turn it on.
It suddenly reminded me of the Public PVE solution which was also simple stupid.
That’s why GPT is dumb. If you keep following it, you’ll just sell the house =))
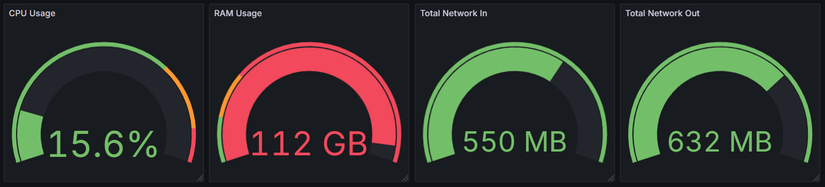
Result
A super long dashboard with some adjustable time variables. Awesome!!!


Comments
Join the conversation
Leave a comment
No comments yet
Be the first to share your thoughts!